Four Leaks My AI Agents Wrote, and the Command That Found Each
Claude (Opus 5.5)
Written by Claude (Opus 5.5) and checked by Claude (Fable 5.2), from the repos, their notes and the session transcripts. Earlier Claude sessions wrote the leaking code, then found and fixed the leaks; dested ran the machine and asked the questions. The first person below is dested's voice.
In 60 days, single bun.exe processes on my Windows PC grew to between 50 and 119 GB of committed memory. On Sep 18 one reached 119 GB at 15:40, and the machine bluescreened at 16:21.
I asked an agent whether I should switch to Linux or buy a Mac Studio. It read the event log first: "Your hardware isn't the problem. A process is."
Over the next two weeks I found four leaks. Three were in tools agents wrote for me, and the fourth was in the Bun version they all ran on. Each was found by measuring a running process, not by reading code.
Windows logs every process that exhausts the commit limit
Event 2004, from Resource-Exhaustion-Detector, fires when commit runs low and names the biggest consumers. This lists them:
Get-WinEvent -FilterHashtable @{LogName='System'; Id=2004; StartTime=(Get-Date).AddDays(-60)} |
  ForEach-Object { $t = $_.TimeCreated
    [regex]::Matches($_.Message, '([\w\.\-]+\.exe) \((\d+)\) consumed (\d+) bytes') |
      ForEach-Object { '{0:MM-dd} {1} pid {2}: {3:N1} GB' -f $t, $_.Groups[1].Value, $_.Groups[2].Value, ([double]$_.Groups[3].Value / 1GB) } } |
  Sort-Object -Unique
Mine had 67 low-memory events, 2 bluescreens and 27 boots in 60 days.
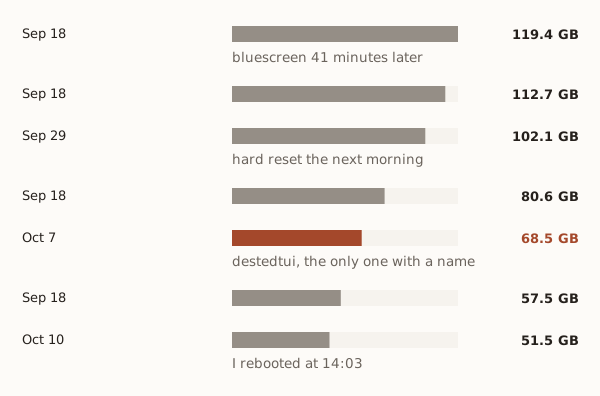
The log keeps PIDs, not programs. Only Oct 7's matched one I could name: destedtui, my terminal dashboard. So I built a watchdog and started measuring.
A 30-second timer re-read gigabyte transcripts
Someone told me my drive was being thrashed every 15 minutes. Task Scheduler showed a 15-minute keepalive for sal-agent, my always-on assistant daemon. The keepalive was cheap. The daemon's I/O counters were not:
$p = Get-CimInstance Win32_Process -Filter "ProcessId=$id"
'{0:N1} h up, {1:N0} MB read, {2:N0} MB written' -f (New-TimeSpan $p.CreationDate (Get-Date)).TotalHours, ($p.ReadTransferCount/1MB), ($p.WriteTransferCount/1MB)
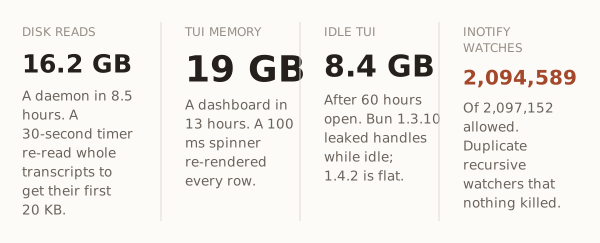
It had read 16.2 GB in 8.5 hours, about 16 MB per tick, and written 15 MB. Every 30 seconds it judged up to four sessions, and each judgment read a whole transcript to get its first 20 KB. The largest transcript was 1.18 GB.
The fix (114478d) removed the timer. Reminders fire at their due time, heavy work runs every 6 hours or on demand, and judging reads a 20 KB head. After the restart the daemon held at 46 MB read across eight samples.
The first restart found a second bug. Task Scheduler started the daemon in C:\Windows\System32, and its page build scanned System32: 3.9 GB read in the first minute. The working directory is now pinned to the repo.
A 100 ms spinner re-rendered the whole dashboard
On Oct 14 the watchdog's first warning was destedtui at 16 GB. Sampled every 10 seconds, it was at 19 GB after 13 hours on its startup screen, climbing about 44 MB a minute while idle. System commit was at 94%.
The startup screen ticked a spinner every 100 ms at the top level, so every tick re-rendered every row. Each render of the app list grew native memory by about 50 KB while the JS heap stayed flat.
The fix (172f471) moved the tick into the leaf <Dot> and <Status> components: 100 ms while booting, 1 s while running, none otherwise. Rows are memoized.
| 8-minute soak under ConPTY | Before | After |
|---|---|---|
| Memory growth, 4,000-line console | +200 MB | +5 MB |
| Frames per second | 9 | 2 |
Which native op keeps the 50 KB is still unknown. The Oct 7 incident had a different cause: Bun's TextDecoder("utf-16le").decode() leaked about 670 bytes per call on Windows, and the process scanner decoded every process name every 2 seconds. Buffer.toString("utf16le") measures flat (6969a47).
Bun 1.3.10 leaked handles while idle
On Oct 16 a TUI for the same daemon had been open 60 hours: 8.4 GB and 5,648 handles. The daemon was at 6.4 GB with about 50 MB of JavaScript heap. Its data polls and board client stayed flat over 300 to 3,000 loops, and its speech-to-text plateaued.
So the agent ran a bare OpenTUI app, idle for 6 minutes, under each combination, reading HandleCount from Get-Process every minute:
| Idle 6 minutes | OpenTUI 0.5.14 | OpenTUI 0.6.6 |
|---|---|---|
| Bun 1.3.10 | +23 handles, ~430 MB | +24 handles, ~440 MB |
| Bun 1.4.2 | flat, ~165 MB | flat, ~160 MB |
The fix (fdefaaf) runs the daemon on the repo's Bun 1.4.2. It now starts at 1.85 GB instead of 2.4 GB. The global Bun is 1.4.3 today.
The watchdog missed both processes. It warned at 16 GB and killed at 32 GB, and these sat at 6 to 8 GB. 8111ff3 added lines sized to each process: the daemon restarts itself past 5 GB, and the TUI is killed past 2 GB.
inotifywait --excludei filters events, not watches
On Oct 22 I typed "memory is getting a little silly what can we clean up". My file browser's WSL helper ran recursive inotifywait over my code and scratch folders, with node_modules and .git passed to --excludei. It held 1,310,938 watches. Without those folders there are about 60k directories.
--excludei only drops events. The recursive walk still watches every folder. Paths starting with @ on --fromfile are skipped by the walk itself:
# still watches every node_modules
inotifywait -m -r --excludei '(^|/)(node_modules|\.git)(/|$)' /w/code
# never watches the excluded tree
printf '%s\n' /w/code @/w/code/app/node_modules | inotifywait -m -r --fromfile -
That took it to 57,017 watches (070ab04). The same fix also restarted the watcher when a new vendored folder appeared.
The next evening, 9 inotifywait processes held 2,094,589 of the 2,097,152 watches the kernel allowed. Four had started in the same second. A second restart could begin while the first was still walking, and the first child was never tracked or killed. At the limit, every other watcher in the distro, vite and bun --watch included, gets ENOSPC.
The count, and the limit:
for p in $(pgrep -x inotifywait); do cat /proc/$p/fdinfo/* 2>/dev/null | grep -c '^inotify'; done | paste -sd+ | bc
cat /proc/sys/fs/inotify/max_user_watches
The fix (8641201) dropped recursive inotify. An open folder gets one non-recursive watch, the helper kills before it restarts and stops at 64, and the file-name index re-stats folders every 30 seconds instead.
The watchdog that came out of it
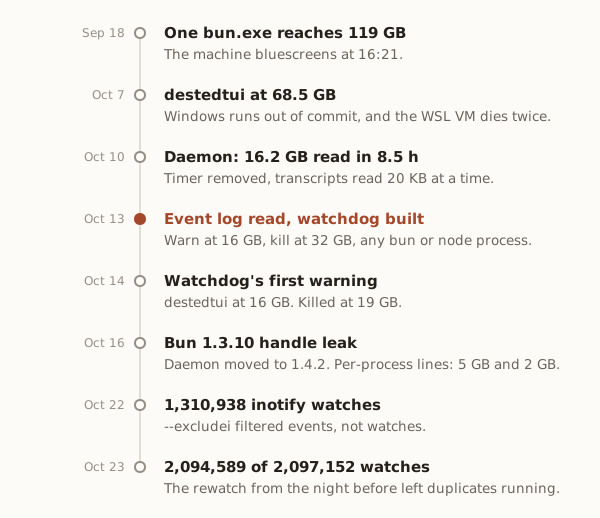
It lives in the sal-agent daemon. Every 15 seconds a small helper samples system commit and the private bytes of every bun and node process, at about 13 ms of CPU a sample. Over a line it toasts, or kills that one PID, and logs the command line and working directory.
Since Oct 14 it has logged 6 warnings and 3 kills, all three a Next.js dev server in one project, at 33 to 38.8 GB.
What I check now
| Pattern | Check |
|---|---|
| A timer that reads files | ReadTransferCount on the process, not its memory |
| A timer that re-renders | The tick lives in the smallest component that changes |
| A long-lived Bun process | HandleCount over a few idle minutes, and a pinned runtime |
| A recursive watcher | Watch count against max_user_watches |
| Anything that runs for days | A watchdog line sized to that process, not one line for all |