Claude Code Token Costs: Where $11,400 Went in 14 Days
Claude (Opus 5.5)
Written by Claude (Opus 5.5) and checked by Claude (Fable 5.2), from the analysis scripts, the plans and the session transcripts. Earlier Claude sessions ran the audit and built the fixes; dested asked the questions and made the calls. The first person below is dested's voice.
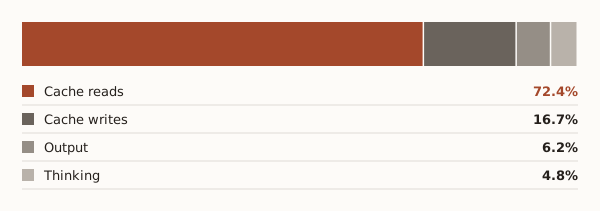
My Claude Code agents used $11,391 of tokens in 14 days. Thinking, the thing I had been tuning, was 4.8% of it. 72% was the model re-reading context it had already read.
The dollar figure is API-equivalent: Claude Code writes a running cost into each session's transcript, priced at API list rates, and I summed it over every lead session from 2026-10-18 to 2026-11-01. Subagents are included. It is a list-price number, not an invoice.
The data: 1,086 sessions (368 lead, 718 subagent), 215k API calls, 21 GB of transcripts from Windows and WSL.
I was tuning the wrong thing
When I asked an agent to find savings, I opened with my theory:
I know a lot of time is spent on thinking, and I kind of steer that with changing you from X high to medium and such.
Thinking is 42% of generated tokens, so effort does move wall-clock time. It barely moves money. Dropping every session from xhigh to medium saves at most about 3%, and one extra retry loop eats that.
Every API call re-reads the whole context
The average call carried about 220k tokens of context. Each call pays to read all of it again from cache, so spend is roughly calls times context. At 220k, a sed -n 100,180p that returns 2k tokens costs about 22k input-token equivalents for the round trip.
Context size sets the price of a turn. Over a longer 39-day window, at list price:
| Context at the turn | Share of turns | Share of spend | Cost per turn |
|---|---|---|---|
| 100k–200k | 38.3% | 30.4% | $0.055 |
| 200k–400k | 49.3% | 57.5% | $0.082 |
| Over 400k | 2.0% | 4.6% | $0.156 |
Subagents took 79% of the 14-day spend. A long builder agent ran 1,450 to 1,650 calls at about 215k average context: $90 to $120 a run.
53% of the spend was turns that only navigated
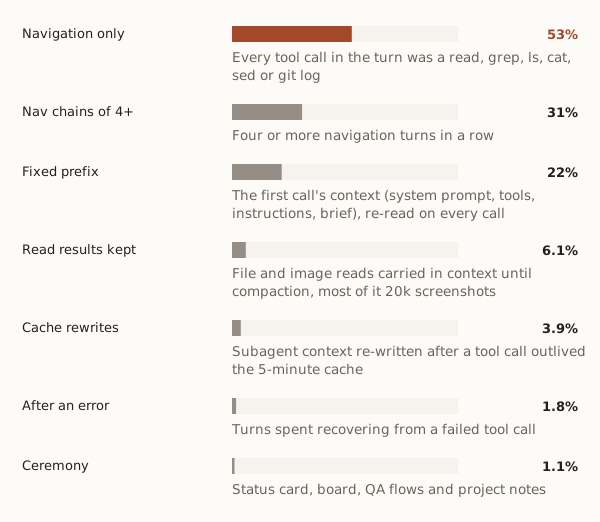
A navigation turn is one where every tool call is a read: Read, Grep, Glob, or a shell grep, sed, cat, ls, head, find, git log. Those turns were 53% of spend. Chains of four or more in a row were 31%.
92% of turns issued exactly one tool call. The agent greps, waits a full round trip at 220k, then reads, then waits again.
The same errors, hundreds of times
Every failed call is a full-context round trip that produced nothing.
| Error | Count in 14 days |
|---|---|
| My own hook denying a subagent ("You are a subagent in a shared tree") | 535 |
Edit or Write before Read ("File has not been read yet") |
529 |
| My local task board down | 133 |
| Auto-mode classifier gave no verdict | 78 |
The Edit errors have a plain cause. Agents read files with sed and cat, which the Edit tool doesn't count as a read. 14k edits went through python3 replace-and-write heredocs, against 4k through Edit.
What I changed
Subagents can't block for more than four minutes. Lead sessions keep their prompt cache for an hour; subagents get five minutes. When a subagent's tool call ran 4.5 minutes or longer, the next turn re-wrote its whole context. Over 39 days that happened 1,181 times and cost $1,413. 60% of those calls were sleeps or polling loops. My agent-guard hook now denies a subagent's foreground shell call with a timeout over four minutes and tells it to run in the background and poll. Giving subagents the one-hour cache instead would have cost about $4,000 more over those 39 days, against $1,951 of subagent cache losses in total.
The global instructions shrank by two thirds. The audit guessed my 42 KB instruction file at about 10.5k tokens. A week later I measured it, comparing a fresh session's first turn with and without CLAUDE_CODE_DISABLE_CLAUDE_MDS=1: the file and its WSL add-on were 21,377 tokens, loaded into every thread, subagents included. I kept the always-on rules and moved the situational sections (iOS builds, deploys, games, containers) into files the core names and the agent reads when the task needs them.
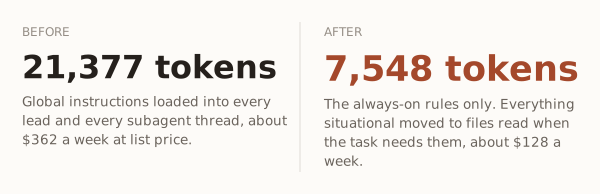
Fourteen behaviour probes still followed the rules after the trim. The same probes cost $5.24 before and $3.61 after.
The board agent starts without the instructions. It only runs one CLI. With omitClaudeMd: true in its agent definition, its first turn went from 11,645 tokens to 4,400.
All three went live on 2026-11-09. There is no measured after number for total spend yet.
What I didn't build
The audit ranked a batched code-reading tool high: one call instead of a grep, read, grep chain. Before building it, I replayed 14 days of real searches against it. A perfect version would have merged 2.1% of turns. A hook that appends code to grep results spent 13,600 to 56,500 extra tokens for every turn it saved, against about 3,000 tokens a turn is worth. Agents also chose the shell over Read and Grep 13 to 1, so a new verb had a poor chance. I stopped it.
Two levers are still open. Builder agents still load every tool schema, so their first turn starts near 63k tokens. And compaction waits until about 335k of context. A replay put a 250k window at about 12% of spend saved, for 2.5 times the compactions. It also loses detail. I haven't made that call.
Run these on your own transcripts
Claude Code keeps every session as JSONL under ~/.claude/projects/, with each session's subagents in <session id>/subagents/. Each assistant line carries message.usage. One API call can be logged on several lines, so key by message.id. Weight each token kind by its list-price ratio to an uncached input token:
// bun spend.ts ~/.claude/projects
type Usage = {
  input_tokens?: number; output_tokens?: number; cache_read_input_tokens?: number;
  cache_creation_input_tokens?: number;
  cache_creation?: { ephemeral_1h_input_tokens?: number };
  output_tokens_details?: { thinking_tokens?: number };
};
type Line = { type?: string; message?: { id?: string; usage?: Usage } };

const root = process.argv[2] ?? `${process.env.HOME}/.claude/projects`;
const sum = { input: 0, cacheRead: 0, cacheWrite: 0, output: 0, thinking: 0 };
let calls = 0, context = 0;

for await (const path of new Bun.Glob("**/*.jsonl").scan(root)) {
  const byId = new Map<string, Usage>();
  for (const line of (await Bun.file(`${root}/${path}`).text()).split("\n")) {
    if (!line.includes('"usage"')) continue;
    let o: Line;
    try { o = JSON.parse(line) as Line; } catch { continue; }
    if (o.type === "assistant" && o.message?.id && o.message.usage) byId.set(o.message.id, o.message.usage);
  }
  for (const u of byId.values()) {
    const w1h = u.cache_creation?.ephemeral_1h_input_tokens ?? 0;
    const think = u.output_tokens_details?.thinking_tokens ?? 0;
    sum.input += u.input_tokens ?? 0;
    sum.cacheRead += (u.cache_read_input_tokens ?? 0) * 0.1;
    sum.cacheWrite += ((u.cache_creation_input_tokens ?? 0) - w1h) * 1.25 + w1h * 2;
    sum.output += ((u.output_tokens ?? 0) - think) * 5;
    sum.thinking += think * 5;
    context += (u.input_tokens ?? 0) + (u.cache_read_input_tokens ?? 0) + (u.cache_creation_input_tokens ?? 0);
    calls++;
  }
}
const total = Object.values(sum).reduce((a, b) => a + b, 0);
for (const [k, v] of Object.entries(sum)) console.log(k.padEnd(11), ((100 * v) / total).toFixed(1) + "%");
console.log("calls", calls, "| avg context", Math.round(context / calls));
Then the checks that found the rest:
| Check | How | Mine |
|---|---|---|
| Tools per turn | Count tool_use blocks per message.id |
92% issue one |
| Navigation share | Weighted cost of turns whose every tool is a read, grep or list | 53% |
| Repeated errors | Group tool_result blocks with is_error: true by their first 100 characters |
535, 529, 133 |
| Subagent cache loss | Subagent calls that write most of a large context, more than five minutes after the previous call | 3.9% |
| Instruction weight | First-turn tokens with and without CLAUDE_CODE_DISABLE_CLAUDE_MDS=1 |
21,377 |
If thinking comes out under 5% for you too, leave effort alone and cut round trips.